I want to share my experience in improving our service latency and the steps I've taken to get there. As a result, the P75 Latency went down from more than 100 milliseconds to less than 5! By de-normalizing the SQL queries and creating one specific cache to fit our needs.
Situation
- Our service is a read-heavy system, with a ratio of 99-1 reads over the writes
- Created in dotnet core, we use EF core as ORM (Object Relational Mapper), and our main DB is Postgres (relational DB)
- We used Redis for caching. But it was not a custom cache but yes a "general propose" one. We used a library that acted as a middleware between EF and the DB, named the Second-Level Cache.
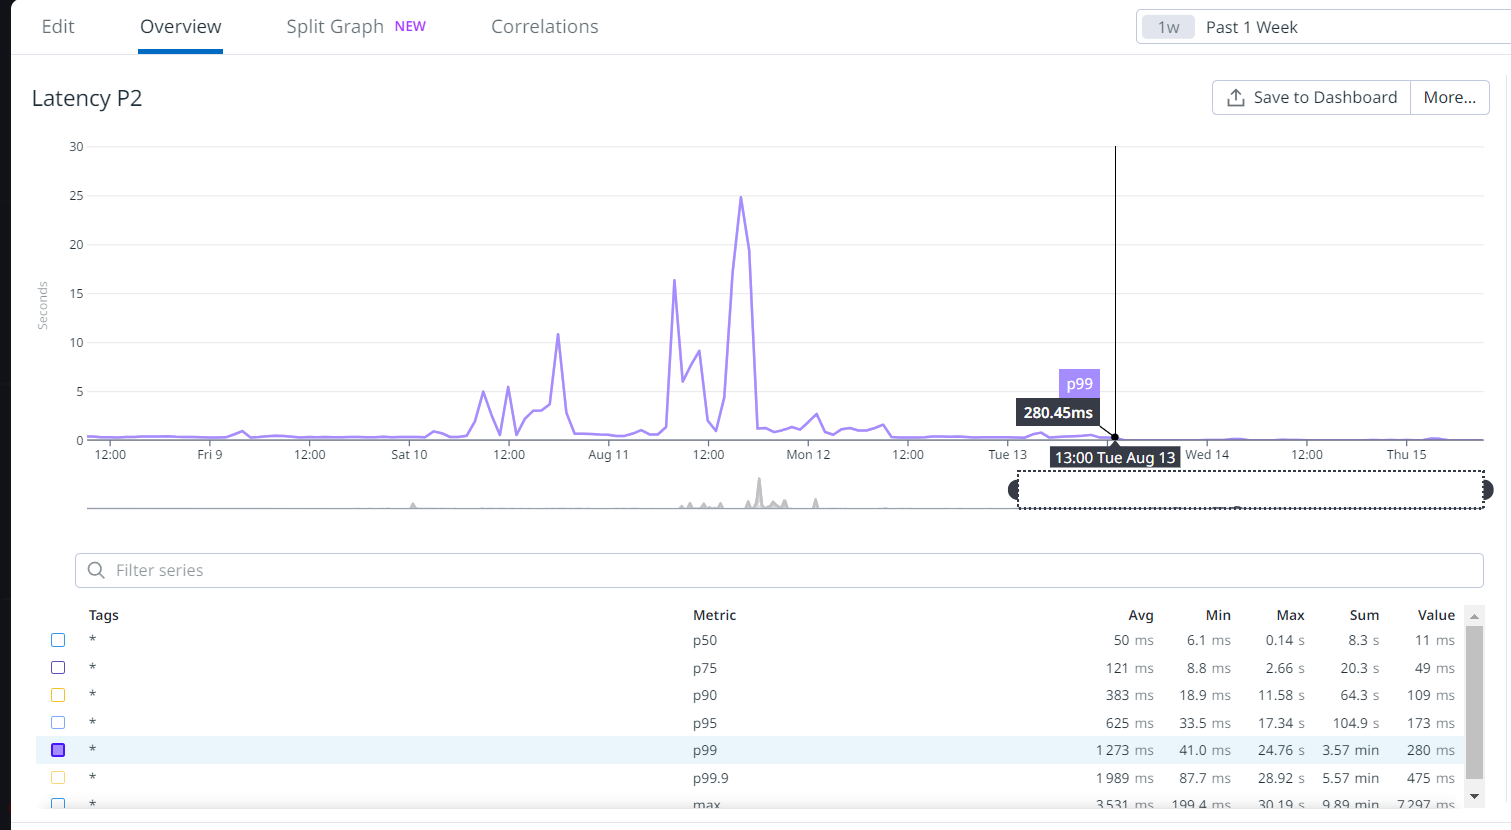
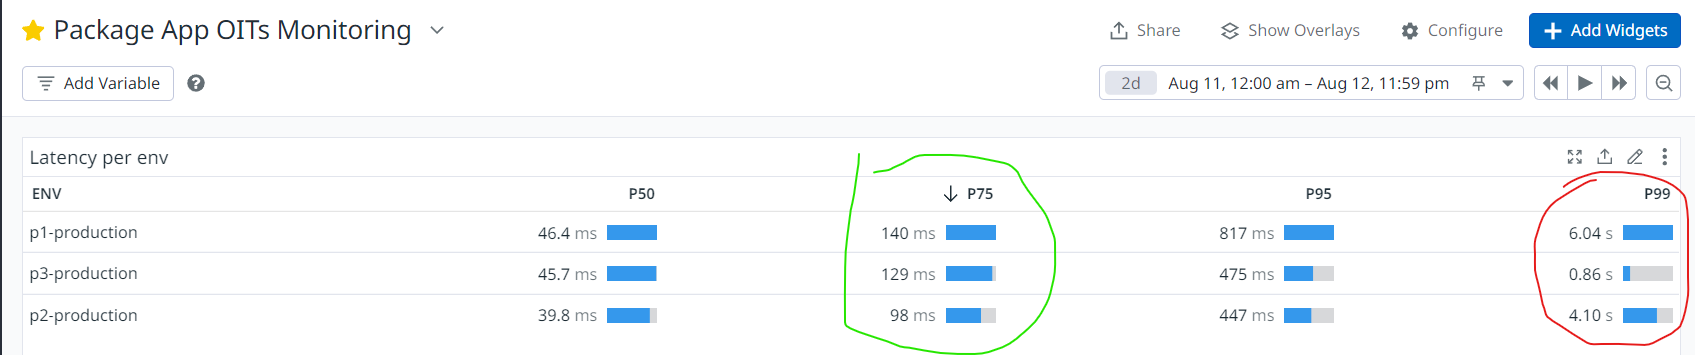
- Very high latency (P75 ~ 140ms and P99 ~ 4s) with high peaks of more than 2 seconds!
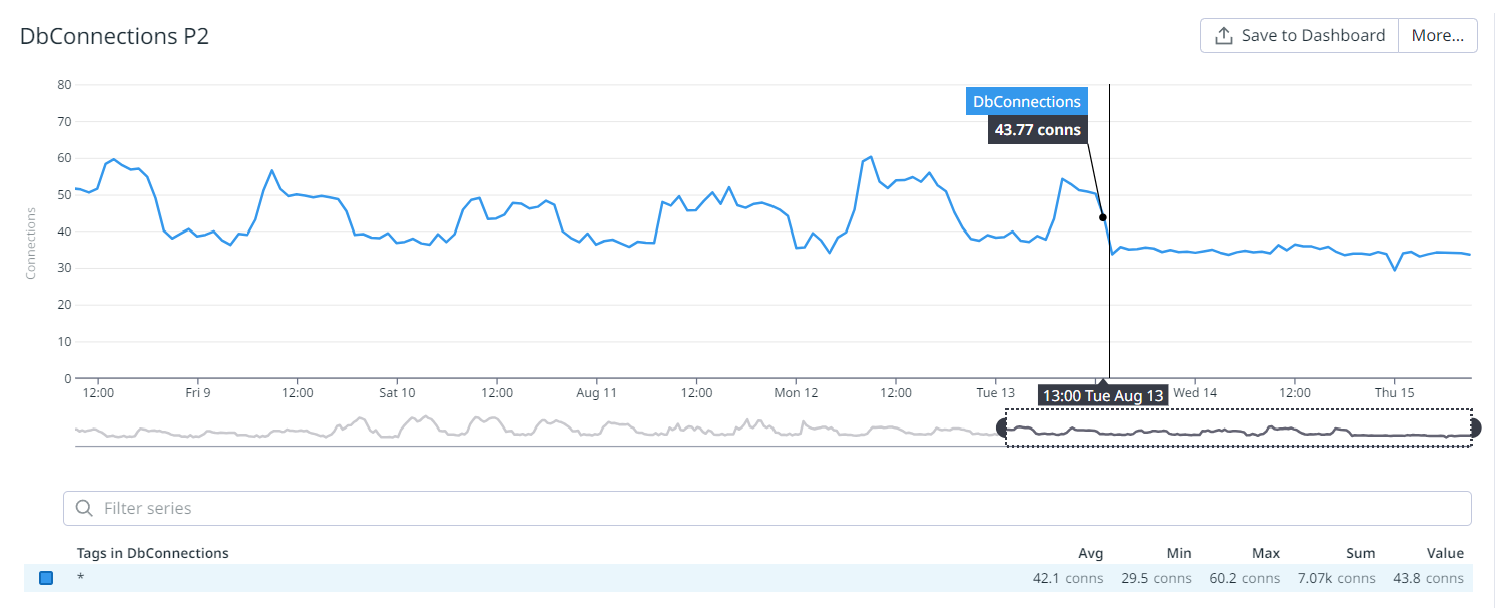
- Frequent incidents! A lot of DB connections were created when the cache was cold, so reached the Postgres connection limit, and new pods were not created, even if existing ones were in a bad state.
Task
My task here was to investigate the situation and find out what could be wrong, trying to pay special attention to the second-level cache since we already suspected that the problem could be there.
Actions
1) Validate our hypothesis: guilty Second Level Cache library
To achieve this I ran some performance tests comparing our endpoint's performance with and without the Second Level Cache library.
I created 2 testing environments, with and without the cache. Then I wrote down a couple of load tests using the K6 library and with the help of this repo ( xk6-output-influxdb), I created meaningful charts that helped to support the results.
The next image is a good sample of the results I've found:
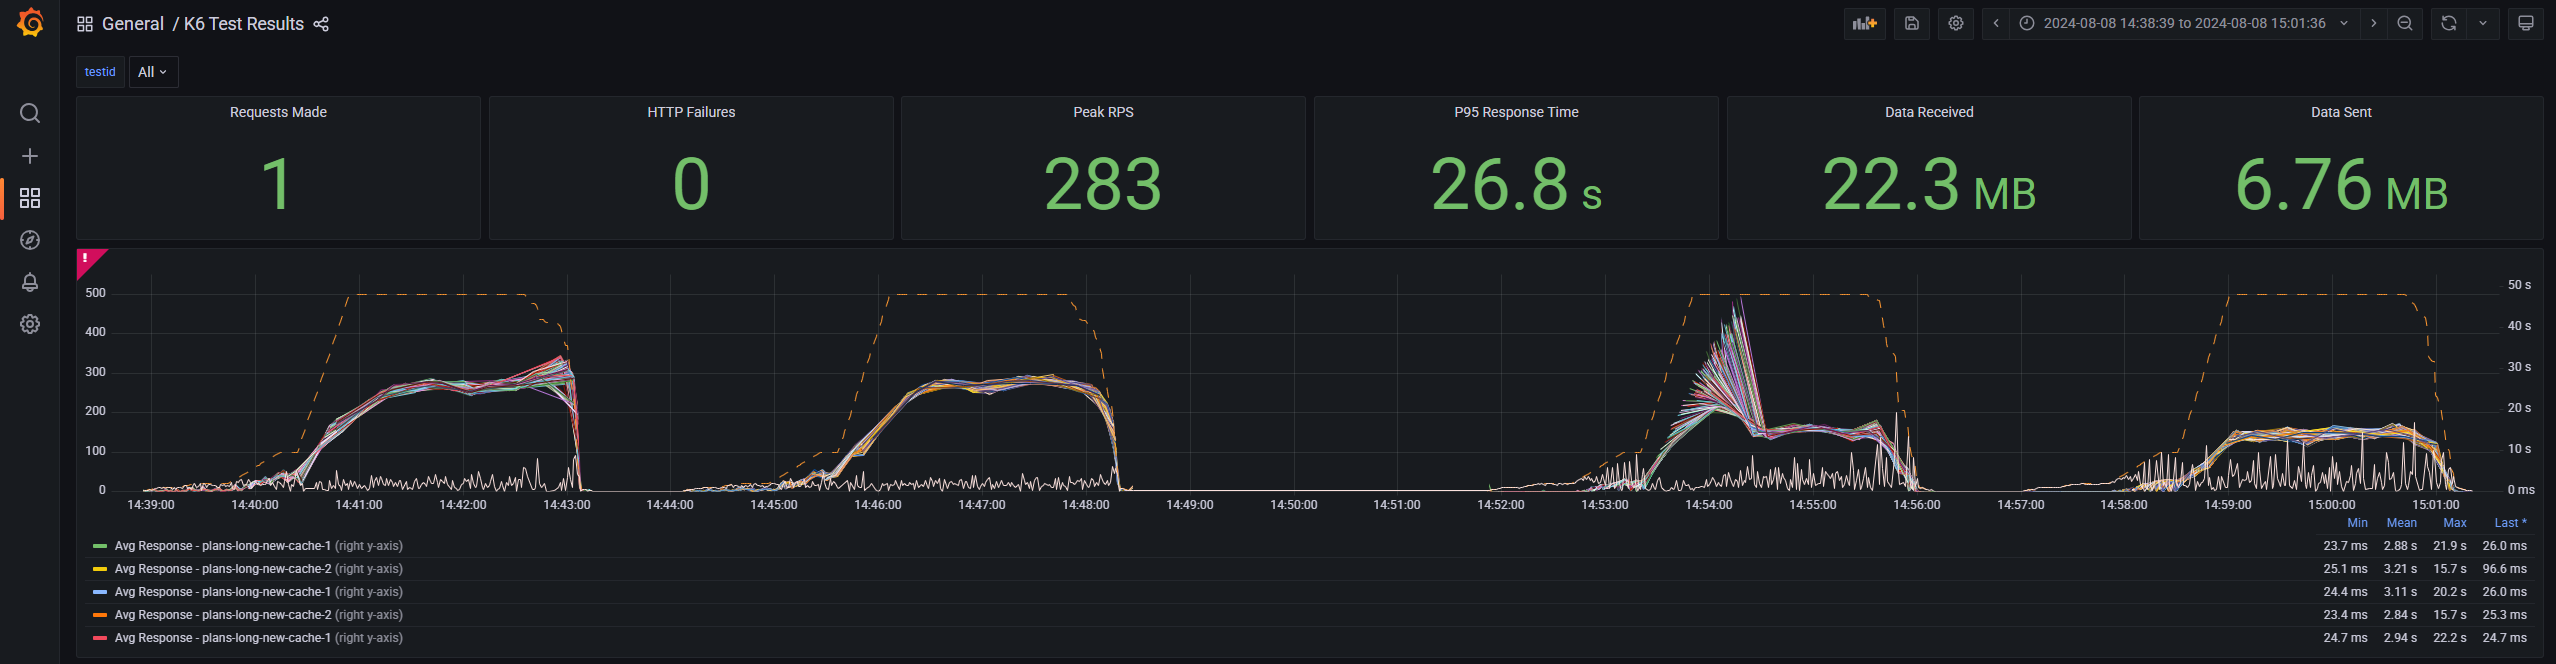
Each line is a different query (with different arguments) made to our service.
At the left: are two consecutive runs to the service that didn't have the cache. We can see higher response times but the lines are stable and predictable.
At the right: are two consecutive runs to the service with the second-level cache. The interesting part is at the first run (with cold cache). Initially, the response times were too high, and many requests failed. Then things improved at the second run (with warm cache). Everything went right and the maximum request time was almost half of the run without cache.
Done! We have validated our hypothesis and demonstrated that, even having better performance when the cache is warmed, when the cache is cold we could have very high latency and unexpected results. Now we needed to find an alternative solution
2) Finding a solution: Create a custom cache
We needed to remove/replace the Second-Level Cache, so the new cache must be between our Services Layer and our DB. To create an effective cache, we needed to change almost all of our queries! So I created what I've called "De-normalize" the queries (which in other words is just removing the joins). By doing this we were able to create a more efficient cache since we could reuse the same cache items across several API requests.
For example, this was one of the old queries we used to have:
SELECT s1."Id", s1."AddressExternalId", s1."CreatedAt", s1."CreatedBy", s1."FacilityAddressId", s1."FacilityId", s1."LastModifiedAt", s1."LastModifiedBy", s1."OccurredAt", s1."PlanId", s1."SubjectId", t."Id", t."Id0"
FROM (
    SELECT s."Id", s0."Id" AS "Id0"
    FROM "SubjectExternals" AS s
    INNER JOIN "Subjects" AS s0 ON s."SubjectId" = s0."Id"
    WHERE s."ExternalId" = @__externalId_0 AND s."SubjectType_Id" = @__type_Id_1
    LIMIT 1) AS t
INNER JOIN "SubjectAddresses" AS s1 ON t."Id0" = s1."SubjectId"
ORDER BY t."Id", t."Id0"
Here we are just getting the complete address from one specific subject. It looks ugly, right? This query is auto-generated by our ORM and if we see the query plan in one prod DB we see this is a very expensive one.
Sort  (cost=1726.96..1726.97 rows=3 width=137)
  Sort Key: s."Id", s1."SubjectId"
  ->  Nested Loop  (cost=5.27..1726.94 rows=3 width=137)
        ->  Limit  (cost=0.83..1710.78 rows=1 width=32)
              ->  Nested Loop  (cost=0.83..1710.78 rows=1 width=32)
                    ->  Index Scan using "IX_SubjectExternals_ExternalType_ExternalId" on "SubjectExternals" s  (cost=0.41..1702.35 rows=1 width=32)
                          Index Cond: (("ExternalId")::text = '69793'::text)
                          Filter: ("SubjectType_Id" = 1)
                    ->  Index Only Scan using "PK_Subjects" on "Subjects" s0  (cost=0.41..8.43 rows=1 width=16)
                          Index Cond: ("Id" = s."SubjectId")
        ->  Bitmap Heap Scan on "SubjectAddresses" s1  (cost=4.44..16.12 rows=3 width=105)
              Recheck Cond: ("SubjectId" = s0."Id")
              ->  Bitmap Index Scan on "IX_SubjectAddresses_SubjectId"  (cost=0.00..4.44 rows=3 width=0)
                    Index Cond: ("SubjectId" = s0."Id")
So this would be replaced by these 2 simpler queries:
SELECT s."SubjectId"
FROM "SubjectExternals" AS s
WHERE s."ExternalId" = @__externalId_0 AND s."SubjectType_Id" = @__type_Id_1
LIMIT 1
and
SELECT s."Id", s."AddressExternalId" AS "ExternalId", s."PlanId", s."FacilityId", s."FacilityAddressId", s."OccurredAt"
FROM "SubjectAddresses" AS s
WHERE s."SubjectId" = @__subjectId_0
After doing these changes, not only simpler queries are faster, but also it is way easier to create the cache which will be reused by all the API requests.
So I did an analysis of all the API endpoints we had and the information they needed and I got the conclusion we only needed 5 of these canonical queries.
Then I created a new query service to be reused across all the endpoints with these 5 methods to wrap these queries. And here in this new service is where the cache will be. A very simple cache-aside implementation (if the key is in the cache return the cached value, and if it isn't do the query and add it).
Cache invalidation is a key factor to consider. Initially, I only considered using a very short TTL (5 minutes) and in a second we changed to a longer TTL (4 days).
I didn't implement the whole thing for the performance tests that I was doing. I just picked up one API endpoint and changed only the queries that were performed there. The goal was to make a point and validate the new solution.
The results of these tests were amazing! A very strong win for the new custom cache implementation. Most of the requests made to the service with the 2nd Level Cache failed, while the service with Custom Cache was able to handle all of them!
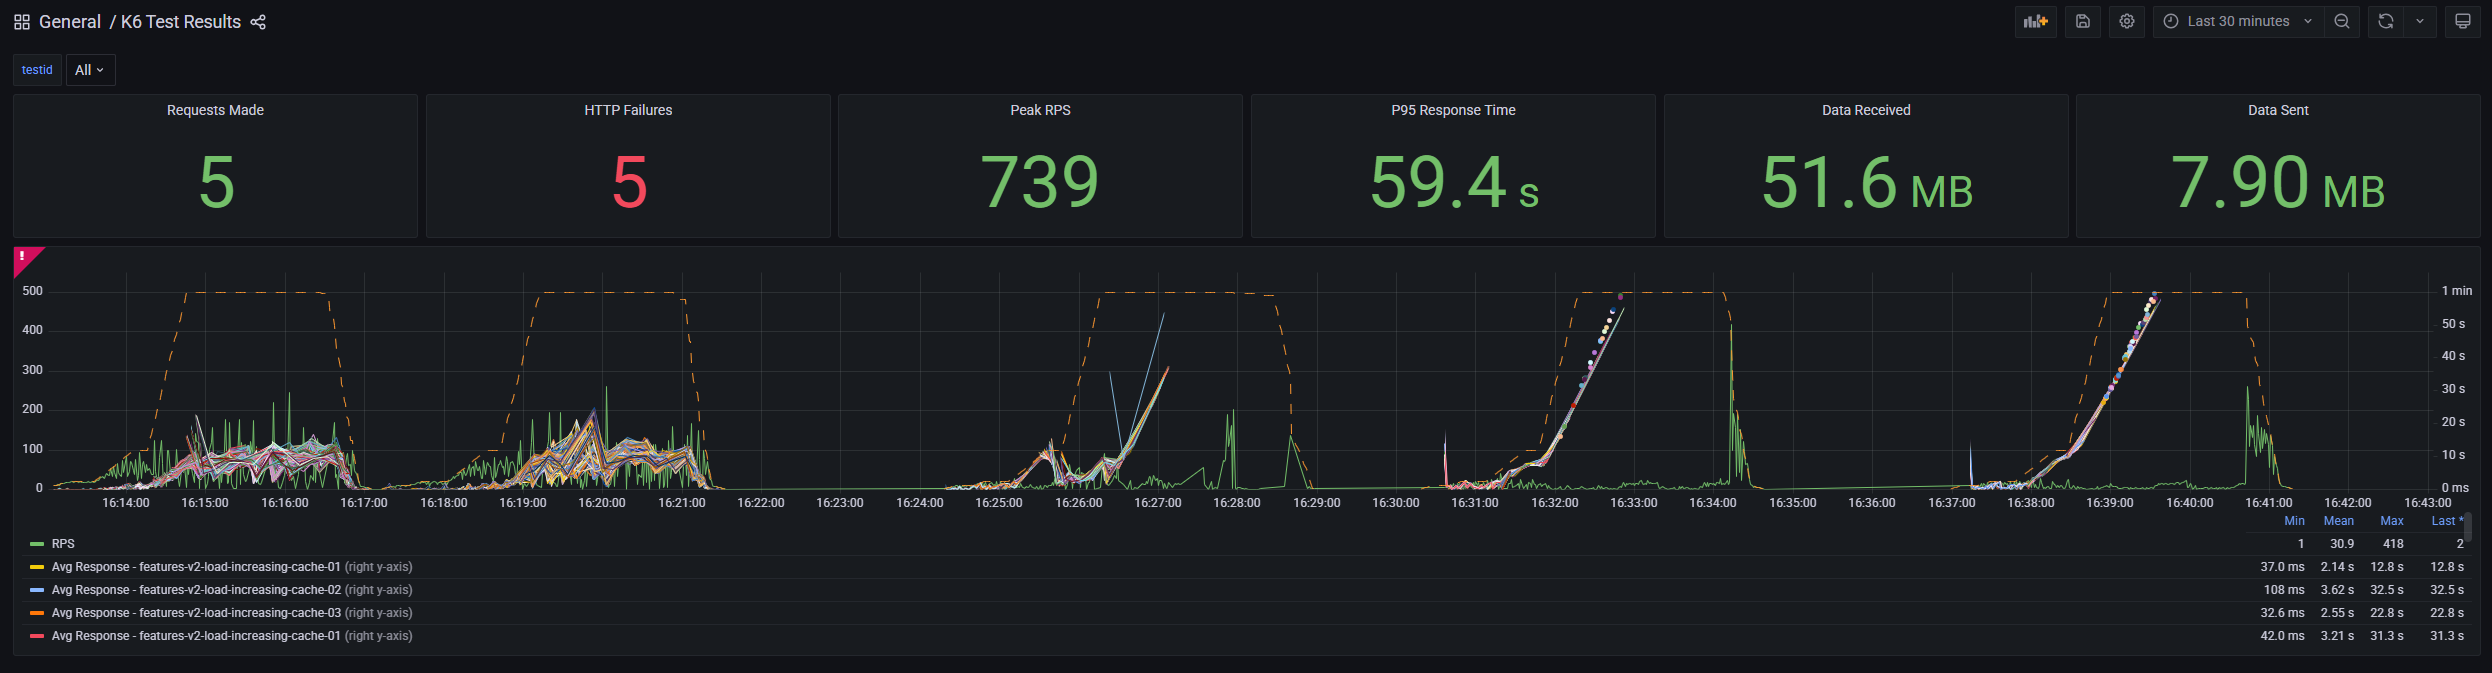
And here are some of the results in numbers (take into account these tests ran against testing environments, but both had the same exact config)
| **http_req_duration** | avg       | min         | med       | max        | p(90)     | p(95)      |
|-----------------------|-----------|-------------|-----------|------------|-----------|------------|
| 2nd Level Cache       | 16.25s    | 0s          | 4.31s     | 1m0s       | 59.92s    | 59.95s     |
| **Custom Cache**      | **5.21s** | **21.56ms** | **5.62s** | **23.74s** | **9.43s** | **10.53s** |

| **http_req_failed** | Failure % | ✗ Error | ✓ Success |
|---------------------|-----------|---------|-----------|
| 2nd Level Cache     | 44.72%    | 1649    | 2038      |
| **Custom Cache**    | **1.18%** | **136** | **11301** |
3) Get it done!
Finally, I got what I was looking for: found the root cause of the performance issues and an alternative solution proved to work much better. The next step was to share this with my team, so I created a document explaining the results and the new proposal and scheduled a presentation.
After gathering some useful feedback I created the roadmap and tasks to implement it, divided into smaller steps. We were able to replace the whole thing in just a couple of weeks.
Result
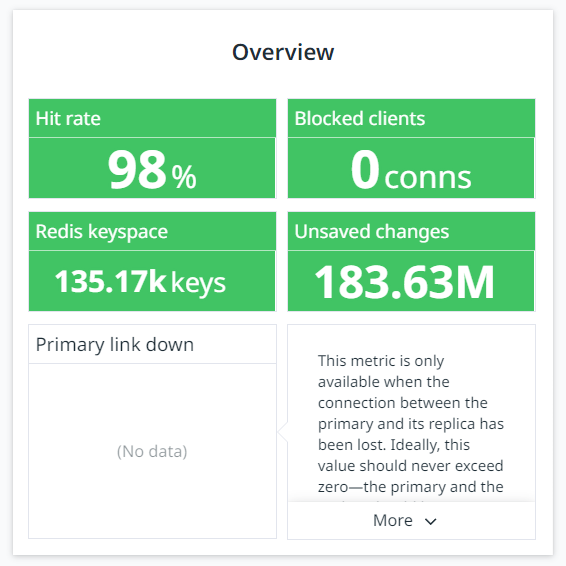
- Incidents were gone forever. We have never experienced a performance issue that caused an incident anymore.
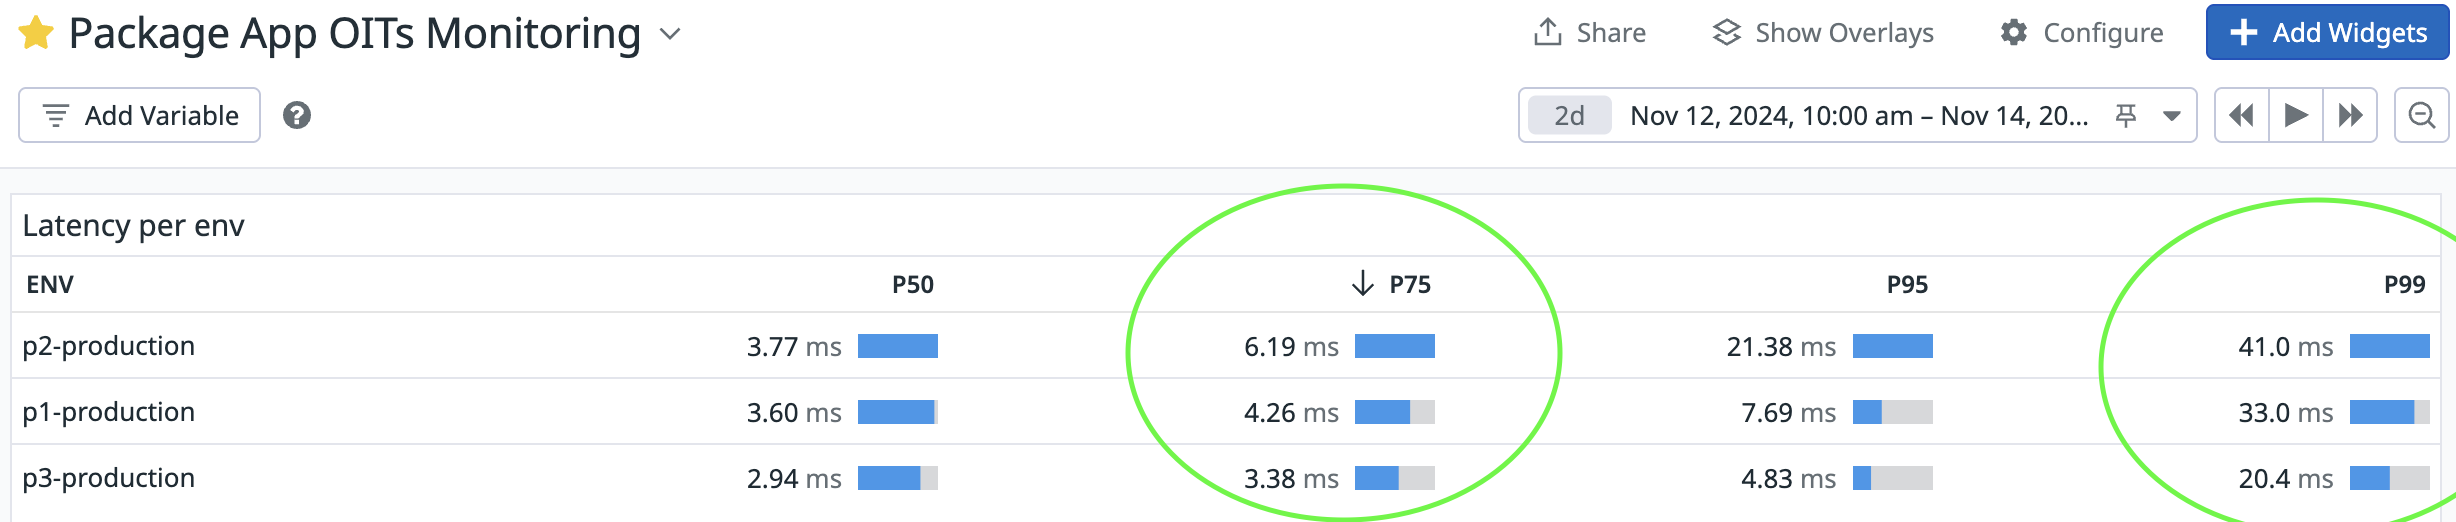
- The main team's goal for the whole quarter was achieved in just a few weeks! One of our team's OITs was getting P75 down to 80ms or less and we achieved less than 10ms.
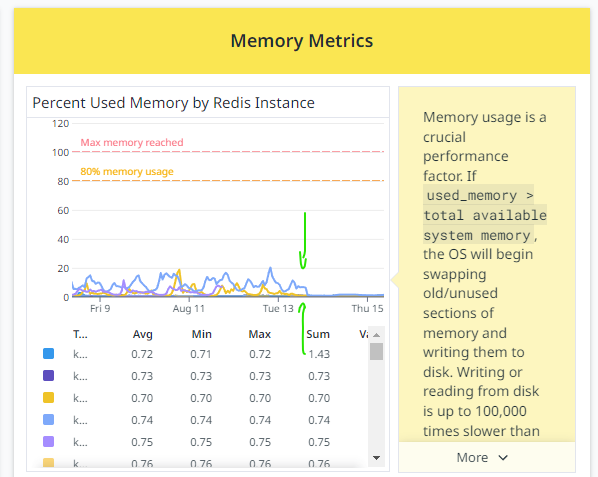
- Money saved! We needed fewer processing efforts and fewer pods, we downgraded the layer for the DB from medium to small, and we needed less Redis memory.
- Open the door to more teams willing to integrate with our service.
- Metrics improved: